
Use analytics
The Analytics module is a tool for evaluating the progress, strengths, and opportunities for improvement in the business and process aspects of your law department.
For example, if companies in a specific area typically pay patent partners $650 per hour and you are paying your patent partner there $800, you now have relevant data—derived from actual engagements with other companies—the next time you negotiate rates with your firms. You can use this index data when putting matters out to bid for law firms, and this data is especially useful if your company is hiring outside counsel in a new and unfamiliar metro area.
The best way to understand what analytics can show you is to experiment with the settings. By selecting different views and filters, you can find the most pertinent information for your department, and information you discover can lead to unexpected improvements in your department's performance and effectiveness.
Select analytics criteria
To use analytics:
- Go toAnalytics.
- The Analytics interface has 2 major sections: the Settings pane and the main display pane. In the Settings pane to the far right, use the Analytic dropdown to select the type of information you want to view, such as Dept. Report Card or Invoice Activity.noteAnalytics will return all the data in Tracker for your department. To ensure useful results, your Tracker Coordinator should review the names of customers, firms, organizational units, practice groups, matter types, and regions.
- Use theView bylist to select the aspect of the information that you want to focus on, such as Matter Type or Substantive Law. The views available in this list depend on the analytic you select in step 1.
- In theRangelist, select one of the following:
- A date range (for example, Recent 4 FQs or This FY)
- A single quarter (for example, Q1/YYYY)
- When you select a single quarter, a second list appears. Select the same quarter or a later quarter in this list to create a custom date range. The maximum range is 12 quarters.
- In theFilter bysection, for any filter that you want to apply, selectedit, and then make your selections.
- SelectRun.
There are 2 ways to save your results: as a PDF file or as a Microsoft Excel spreadsheet.
- To save the table data to a PDF, select the 3 small dots icon
 , then select Export to PDF.
 - To save the table data to a spreadsheet that you can sort and filter, select theExcelicon
 .
.
Interpreting results
You can compare analytics data against data from other companies that use Tracker to visually analyze trends over time and dig deeper to understand any changes. Index data helps you assess the efficiency of your law department operations and management. Compare your spending and risk data against similarly situated law departments for insights into your performance.
For example, you can quickly see the average length of time it takes to approve invoices in your department compared to others, or you can compare your law department’s annual spend on litigation matters to other similarly sized companies in your same industry.
Examples
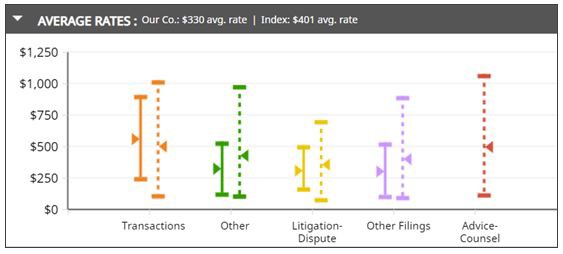
Average Rates - Index Comparison
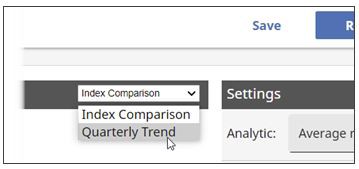
Average Rates - Quarterly Trend
Department Report Card - By Substantive Law
Use analytics filters
- Setting filters- To set filters for a specific source of data, such as substantive law or matter type, selectediton the corresponding filter bar. A window box opens up in which you can select the sources of data you want to see. You can type in the search field or scroll through the list on the left, and when you select an item, it appears in the list on the right.When you have set your filters, selectRunon the toolbar to create your visualization.
- Saving filters- You can save your filters so that they can be reused. SelectSaveon the toolbar and use the prompt to assign a name and description. The filter will be available from the Saved Analytics List on the Settings pane.
- Viewing filters- To view or hide the list of the filters you've selected, select the triangle in the filter bar. You can also remove individual filters or clear all the filters when the list is visible.Selections in the filter pane don’t persist between analytics. Your selections for View By, Range, and Filter are cleared if you select a different item from the Analytic list.
- Views versus Filters- Depending on the type of information you select in the Analytics list, there may be multiple ways to view and filter it. Views are different from filters.
- View: The selected information is sorted in a specific manner. You can select only one view at a time.
- Filter: Only a portion of the selected information is displayed. You can apply as many filters as you'd like.
Examples
The settings pane
The
Settings
pane is where you select the parameters of the information you want to view. Use these controls to focus on the specific information you're interested in.Option | Description |
|---|---|
Analytic | The Analytic list displays the types of information that are available, such as report cards for your company or for your firms, average timekeeper rates, and invoice activity. Saved filters appear here under Saved Analytics List. |
View by | The View by list controls the way that information is organized in the display pane. For example, you could view timekeeper rates by matter, by substantive law, or by metro area. The views that are available depend on the analytic you select. |
Range | The Range list determines the date range for the information you want to view. You can view a single quarter, a single year, or a specific range of quarters, with a maximum range of 12 quarters. Quarters correspond to your company's Tracker settings: if your company follows the calendar year, Q1 begins in January. If your company starts the fiscal year in July, Q1 begins in July. |
Filter by | Use the Filter by controls when you want to see information from a specific source. Filters are always available for matter type, substantive law, country, and peer group (other companies in your industry or spending range). Depending on the type of analytic you select, additional filters may be available. For example, if you select Firm Report Card, you can select to view information for only selected firms. If you select the Invoice Activity analytic, you can focus on specific invoice formats or invoice approvers. |
The display pane
After you select an analytic, view, date range, and filters, select
Run
in the filter pane. The display pane shows the relevant data, including index data from Tracker, such as line graphs, bar charts, and tables. The format of the display depends on the analytic you select. Index data (compiled from other companies and firms) is also shown.note
To ensure that the information is easy to read, only the highest five values are displayed. A note in the display pane indicates whether other information is available.
- Data indicated with solid-colored lines are your data. Data indicated with dotted lines indicate benchmark data. This information lets you compare with how your information compares to industry averages.
- To show trends, selectQuarterly Trendon the title bar.
- An underlined value in a table is a link to related information.