When analyzing the "2020 Am Law 200" list, to get a truer picture of the legal industry, it would be wise not to look at the concept of industry "averages"
This 3-part series was written by Bruce MacEwen and Janet Stanton of Adam Smith, Esq.
“Don’t think of elephants,” runs the childhood taunt, with the immediate effect that elephants are the only thing you can think about.
At the risk of defeating our own efforts before we start, then, if we had to reduce our guidance on the 2020 Am Law 200 list to one phrase, it would be, “Don’t think of averages.”
Why not averages? The word itself (we checked) appears 14 times in the June 2020 issue of The American Lawyer, which published this year’s complete Am Law 200 listing. And being presented with a list or ranking seems to call forth in those of an analytic bent the irresistible impulse to start asking about averages. We’re here to tell you that would be mistake of the first order when looking at the Am Law 200.
Why? Primarily because averages can be a helpful and informative component of generating a summary or overview of data distributed over a standard or normal or bell curve. However — and this is the key — the Am Law 200 represents data distributed over a power curve. With this type of distribution, averages don’t just mislead; at times, they may in fact lie.
What’s the difference?
Here is a bell curve we drew in Excel:
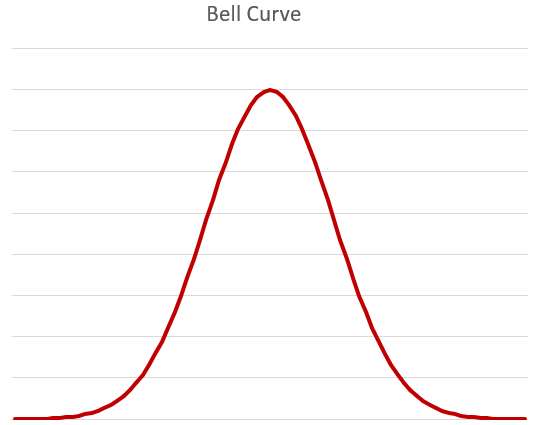
Looks familiar. Now check out the power curve:
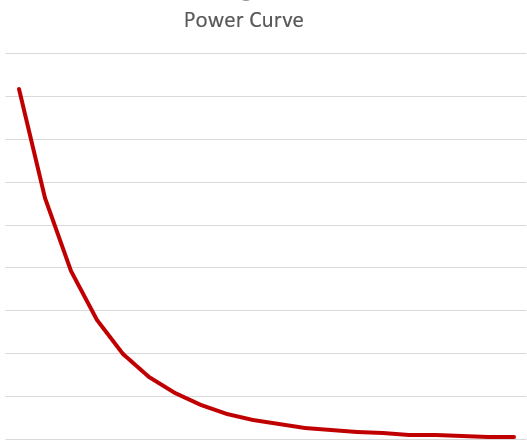
Rather than us asserting this, permit us to show you.
Three of the key data series in the Am Law numbers are i) gross revenue; ii) total profits (known as net operating income); and iii) lawyer headcount. Here’s what each of those series looks like by deciles — the 200 firms in 10 groups of 20 firms each:
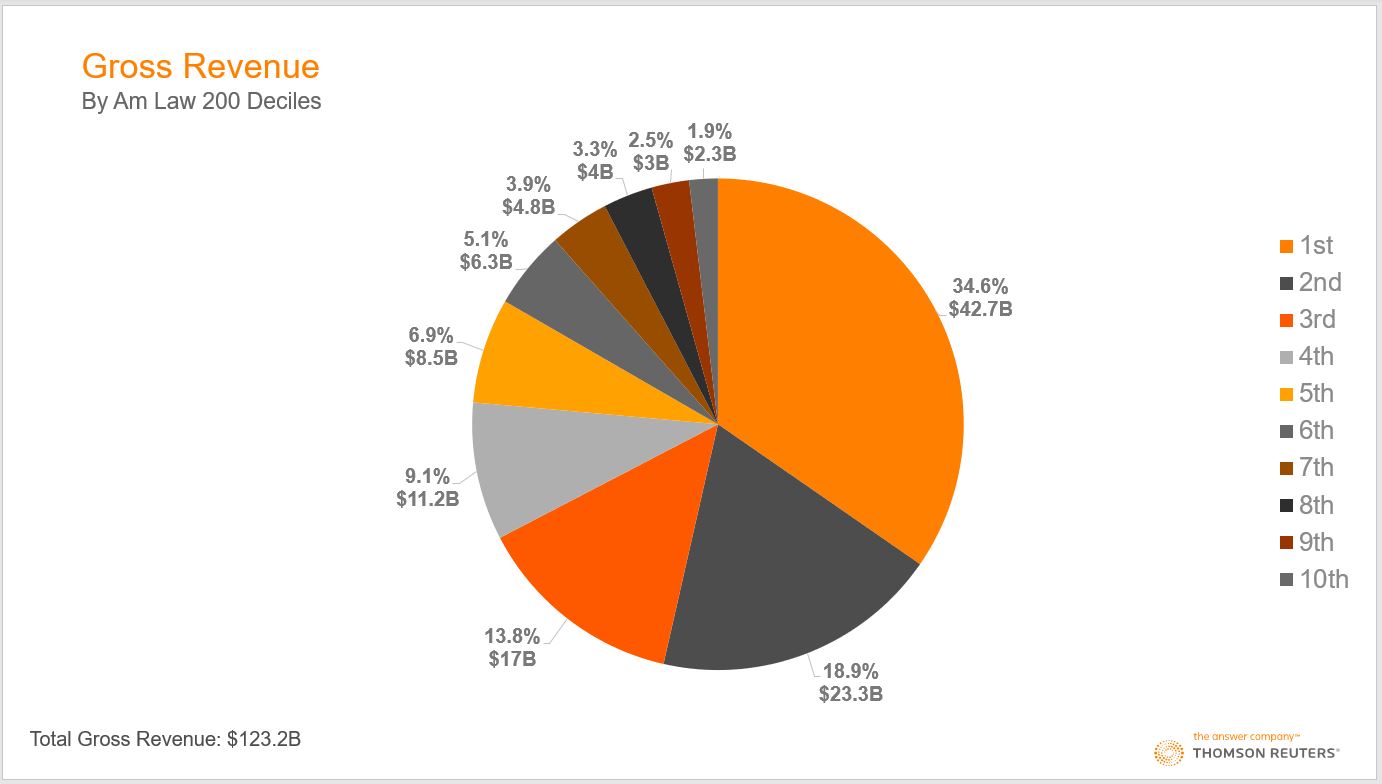
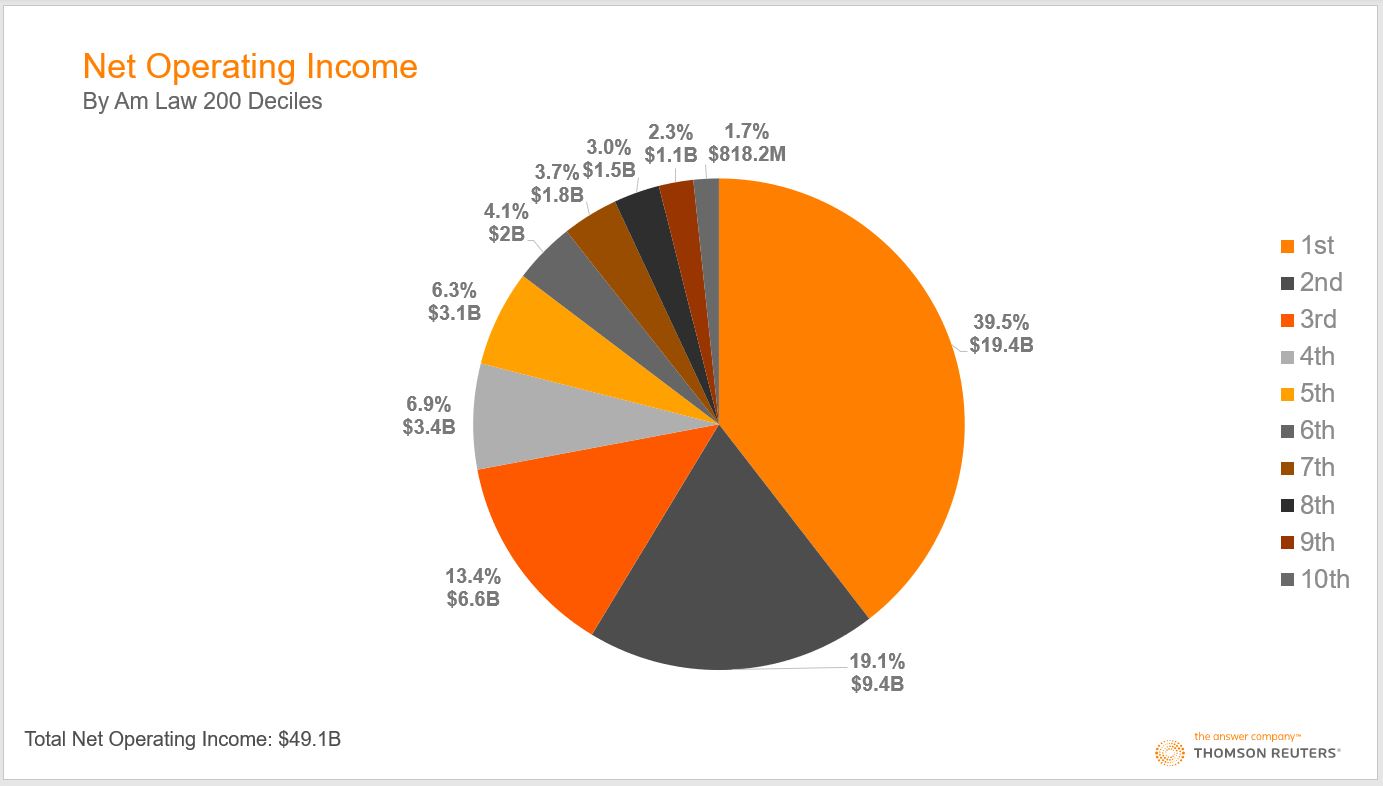
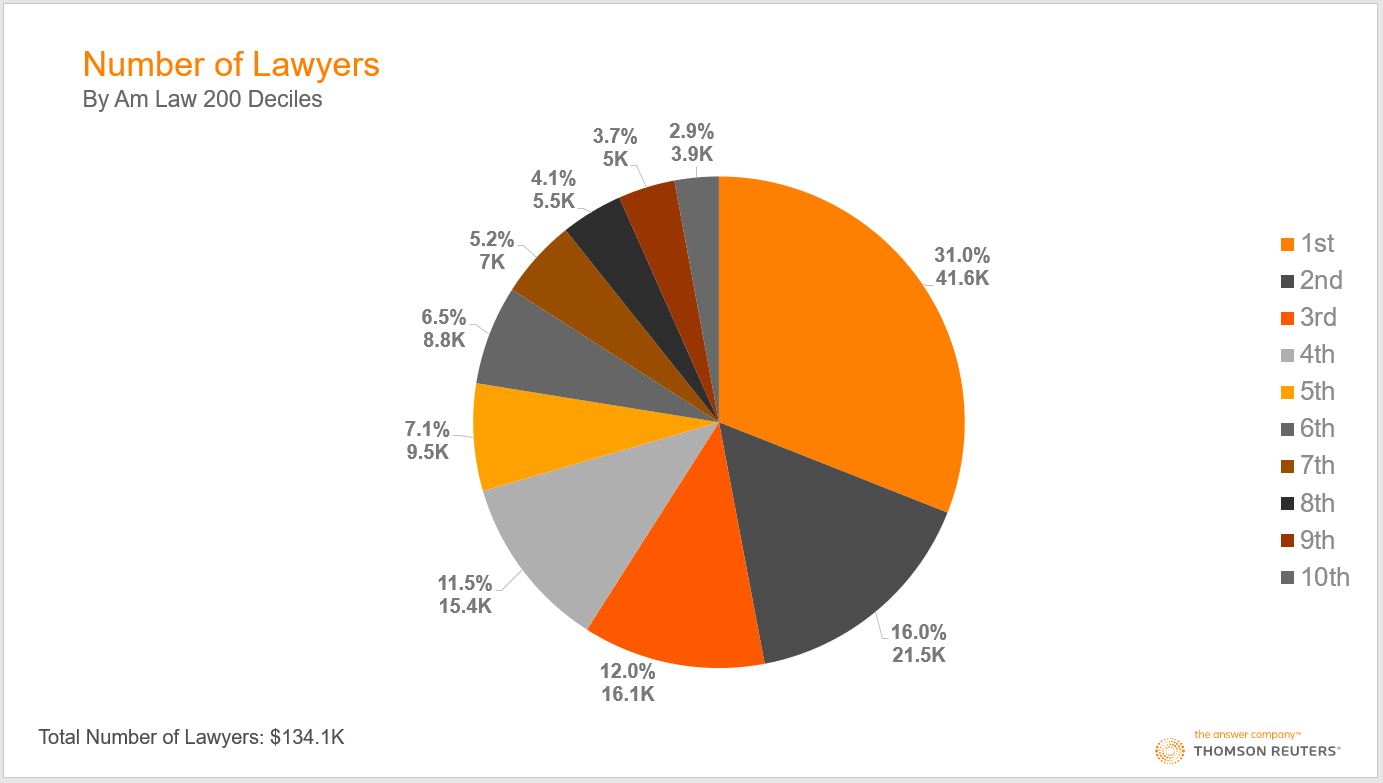
All three charts, we submit, tell essentially the same story: Beginning at the top of the pie charts and moving clockwise, you can see that the first two deciles account for more than half (about 53% on average) of the entire 200, and the bottom four deciles account for roughly 10%. Another way of expressing the same point — and to see how strongly skewed this distribution is — is that the top five firms generated nearly as much revenue ($16.6 billion) as the bottom 90 firms ($17.1 billion).
All very interesting, of course, but how does that make a point about averages? The American Lawyer reported that “average revenue and profit growth for the Am Law 200 were both 5% last year.” Fair enough. One’s mind inevitably jumps to the presumption that the vast majority of the 200 firms therefore grew pretty close to that 5% rate in revenue and profits. But there are a host of other ways of generating a 5% average for those critical and high-profile data series that would reflect no such reality.
For example, here are a few other ways to end up with that 5%:
-
-
- The top 10% of firms each grew 10% and the other 180 firms grew 1.5%
- The top 20% of firms each grew 9% and the other 160 experienced zero growth.
- The top 100 firms each grew 17% and all the other firms went out of business—and were not replaced at all in the Am Law 200.
-
Obviously these three scenarios — granted, some more surreal than others — describe quite incongruous states of the world. But all dovetail perfectly with a “5% average.”
What’s the moral?
In analyzing power curves, you have to toss out the familiar Stats 101 playbook and think harder. One should ask, “Are there meaningful and informative generalizations one can draw about this dataset of firms?” (Don’t assume the answer has to be yes; maybe it’s mostly noise with only a very weak and tenuous signal.)
Other questions include, “What am I really trying to figure out?” or “If doing a straight-up comparison of revenue, net operating income, or lawyer headcount is not actually revealing, what would be?”
“Do I need to compare firms within subsets and not across the entire 200?” “What classification mechanism would be helpful in defining the borders of those subsets?” And most importantly: “What information (if I could derive it) would actually change the way I manage and behave?”
One of our core beliefs is that data is almost always trying to tell a story, and our job is to figure out what that narrative is.
Coming up, we’ll suggest some of our own hypotheses about that story, and in the process ask you to question whether the Am Law 200 — or Am Law 100 or Second Hundred, for that matter — are even useful categories at all.
Meanwhile, get the elephants out of your brain.


