There are several goals that are common among professional service organizations – being faster, better, cheaper, bigger or simpler; having higher firm profits; or employing an engaged, diverse workforce. While the pathway to achieving these goals can vary, I can’t think of a better way to achieve them than data analytics.
I meet a lot of lawyers who agree about data’s potential. Yet, I can’t name many corporate law departments or law firms that are prioritizing the data analytics function. Technical challenges like lacking data “interoperability” are part of the story, of course, but a bigger challenge to using analytics more fully is convincing leaders about its compounding property.
To accelerate adoption, I want to offer a playbook for getting started with data analytics. Three concrete examples can easily demonstrate how an analytics model helps stakeholders calibrate and act upon beliefs about their business. For those looking to get started, I’d recommend collaborating with a data analyst on these three specific tasks:
-
-
- Identify a question about your organization, and state it in comparative terms. For example, “When the US economy is more volatile, is my firm’s annual revenue higher or lower?”
- Find the data and then use it to answer the question and rule out alternative explanations.
- Summarize your findings in plain terms. Write down one action you could take in response to the information.
-
Analytics as a mental model
Analytics helps us calibrate our beliefs. By combining past experiences with new information, such as model-based predictions, we learn to focus on factors that drive business outcomes. Responding to these factors is how organizations profit from taking action. In a larger sense, using data to correct judgment errors will support a more equitable legal profession.
Simply put, using analytics means deriving and calculating comparisons. I’d guess that 99% of business leaders rely exclusively on descriptive ones. Are we above or below the firm’s historical fees total at the end of Q2? Who are the firm’s most satisfied employees? Are we retaining ethnically diverse associates at the same rate as white associates?
A modern analytics function, however, is tasked with explanation and prediction; and this shift makes it possible to isolate patterns and make proactive decisions. The problem with descriptive analytics is that it’s often about one or two factors, which limits our ability to test alternatives. Lawyers are skilled at formulating alternative explanations, and by using predictive analytics we can test their alternatives and shore up conclusions.
Designing useful analytics
To make this mode of thinking concrete, imagine that one of your firm’s managing partners is focusing on future revenue. While firm partners as a whole have lots of opinions about what economic factors influence firm fortunes, it would be nice to know whether their wisdom rings true, or whether some of their ideas are better than others.
To state the question in comparative terms, you can ask, “When an economic indicator like unemployment is high/low, is my firm’s revenue higher/lower than average?” The field of statistical forecasting has tools to answer this question.
Lawyers are skilled at formulating alternative explanations, and by using predictive analytics we can test their alternatives and shore up conclusions.
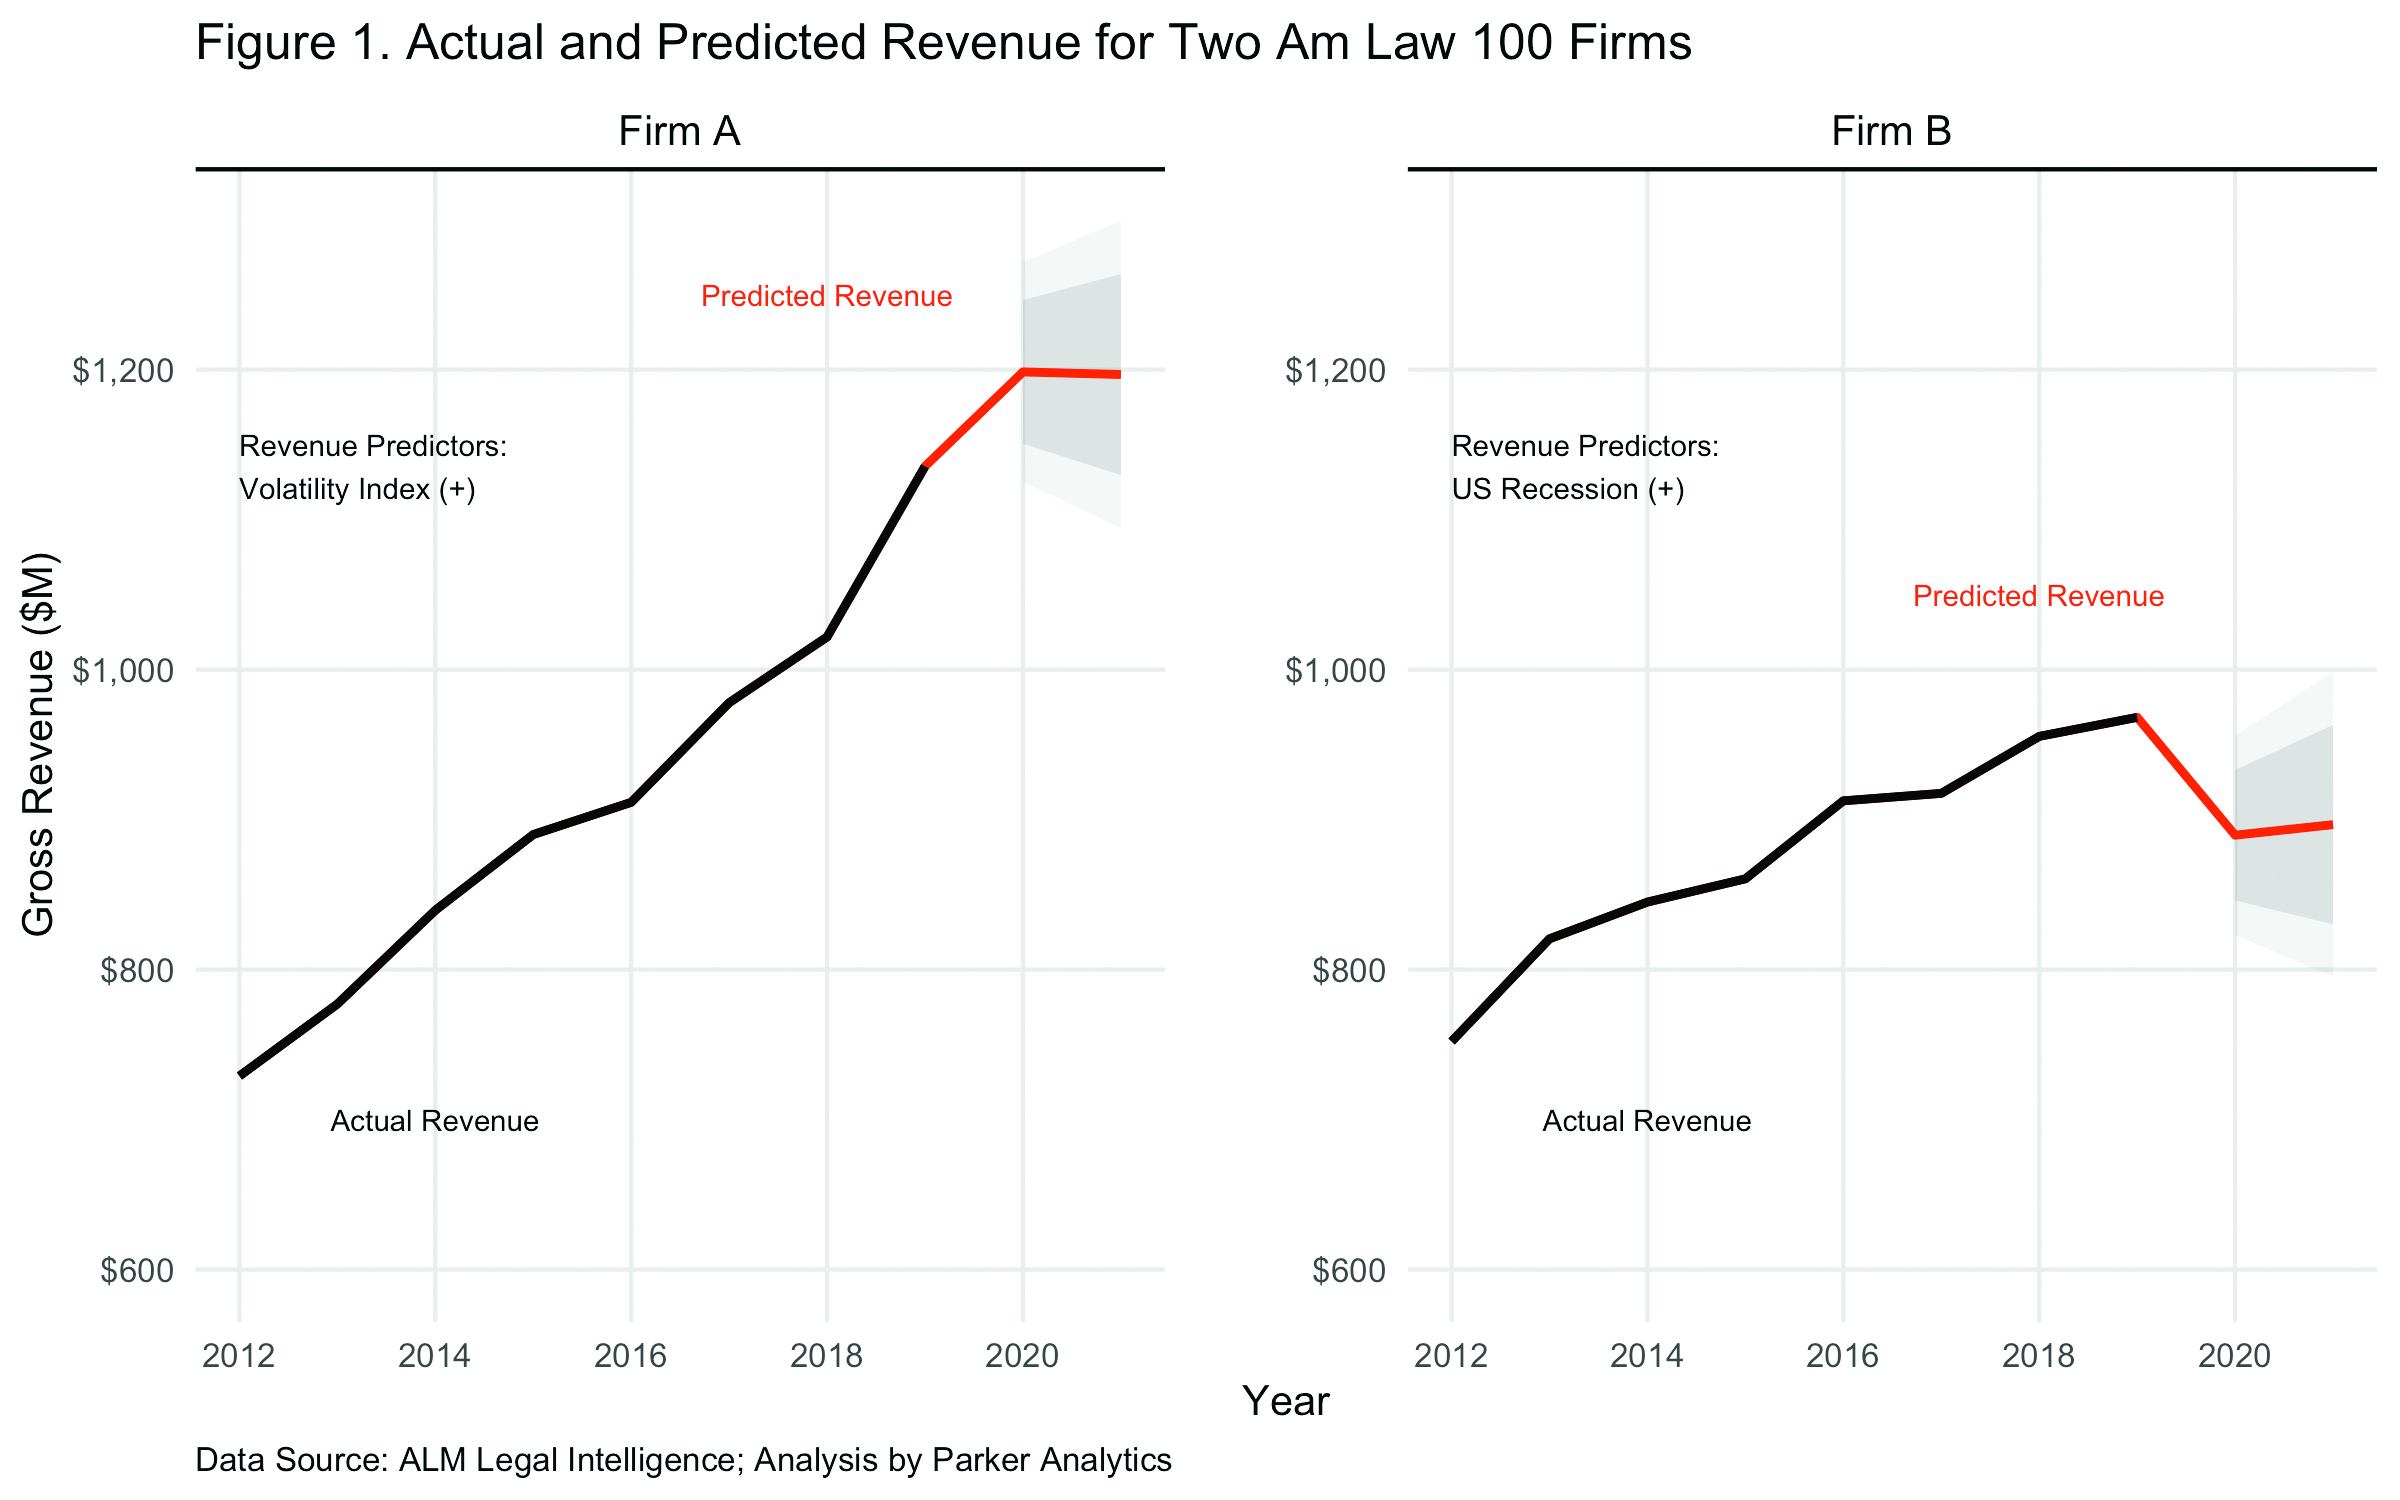
Using two sampled Am Law 100 firms’ annual gross revenue from 1990 to 2019, for example, I used an algorithm to select economic factors that best predict each firm’s revenue trend. Figure 1 reports the 2012 to 2019 annual totals for “Firm A” and “Firm B” and predictions for 2020 to 2021.
The forecasts reflect what each firm is likely to collect in revenue based on its past revenue dynamics and 2020 to 2021 economics. Through this process, we obtained information about which economic factors matter for which firms. Now, let’s state what we learned in plain terms.
For Firm A, there were two economic factors – the Volatility Index (VIX) and the Nasdaq Index – that are positively and significantly related (+) to gross revenue. All else being equal, when the VIX and Nasdaq are relatively high, Firm A’s revenue is high, too. Then, by using predictive analytics, we can calculate expected FY2020 and FY2021 revenue totals reflected in the orange line in Figure 1. So, we can see that Firm A’s managing partner can expect increases from the firm’s 2019 revenue in the ensuing two years.
Analytics tells a different story for Firm B, where two economic factors – the probability of a US recession and the unemployment rate – were shown to be the best predictors of revenue. Firm B does better when the US is in recession (+), but it does worse when unemployment levels are high (-). In terms of the predictions, Firm B’s managing partner can expect decreases from the firm’s 2019 revenue in 2020 and 2021.
The good news is there are compelling interoperability solutions under development in legal.
This exercise underscores the value of a firm’s reliance on analytics: Begin from strong views, and leave room for updating. Also, remember that the new information could be belief-confirming or disconfirming, and adjust accordingly. For example, perhaps your chief talent officer thought employees’ flexible scheduling was essential. Yet, data analytics shows us the biggest driver of engagement actually is employees’ sense of increased responsibility.
There’s no better place to work on increasing objectivity than in areas where human judgment is faulty. For example, diversity, equity and inclusion (DEI) work that is done using data lets leaders recalibrate asymmetric thinking. And with individual-level data, DEI leaders can dive into long-standing questions about retention and promotion, asking “Do ethnically diverse associates have longer/shorter tenure at the firm than white associates?” – which now can be seen clearly as an analytics question.
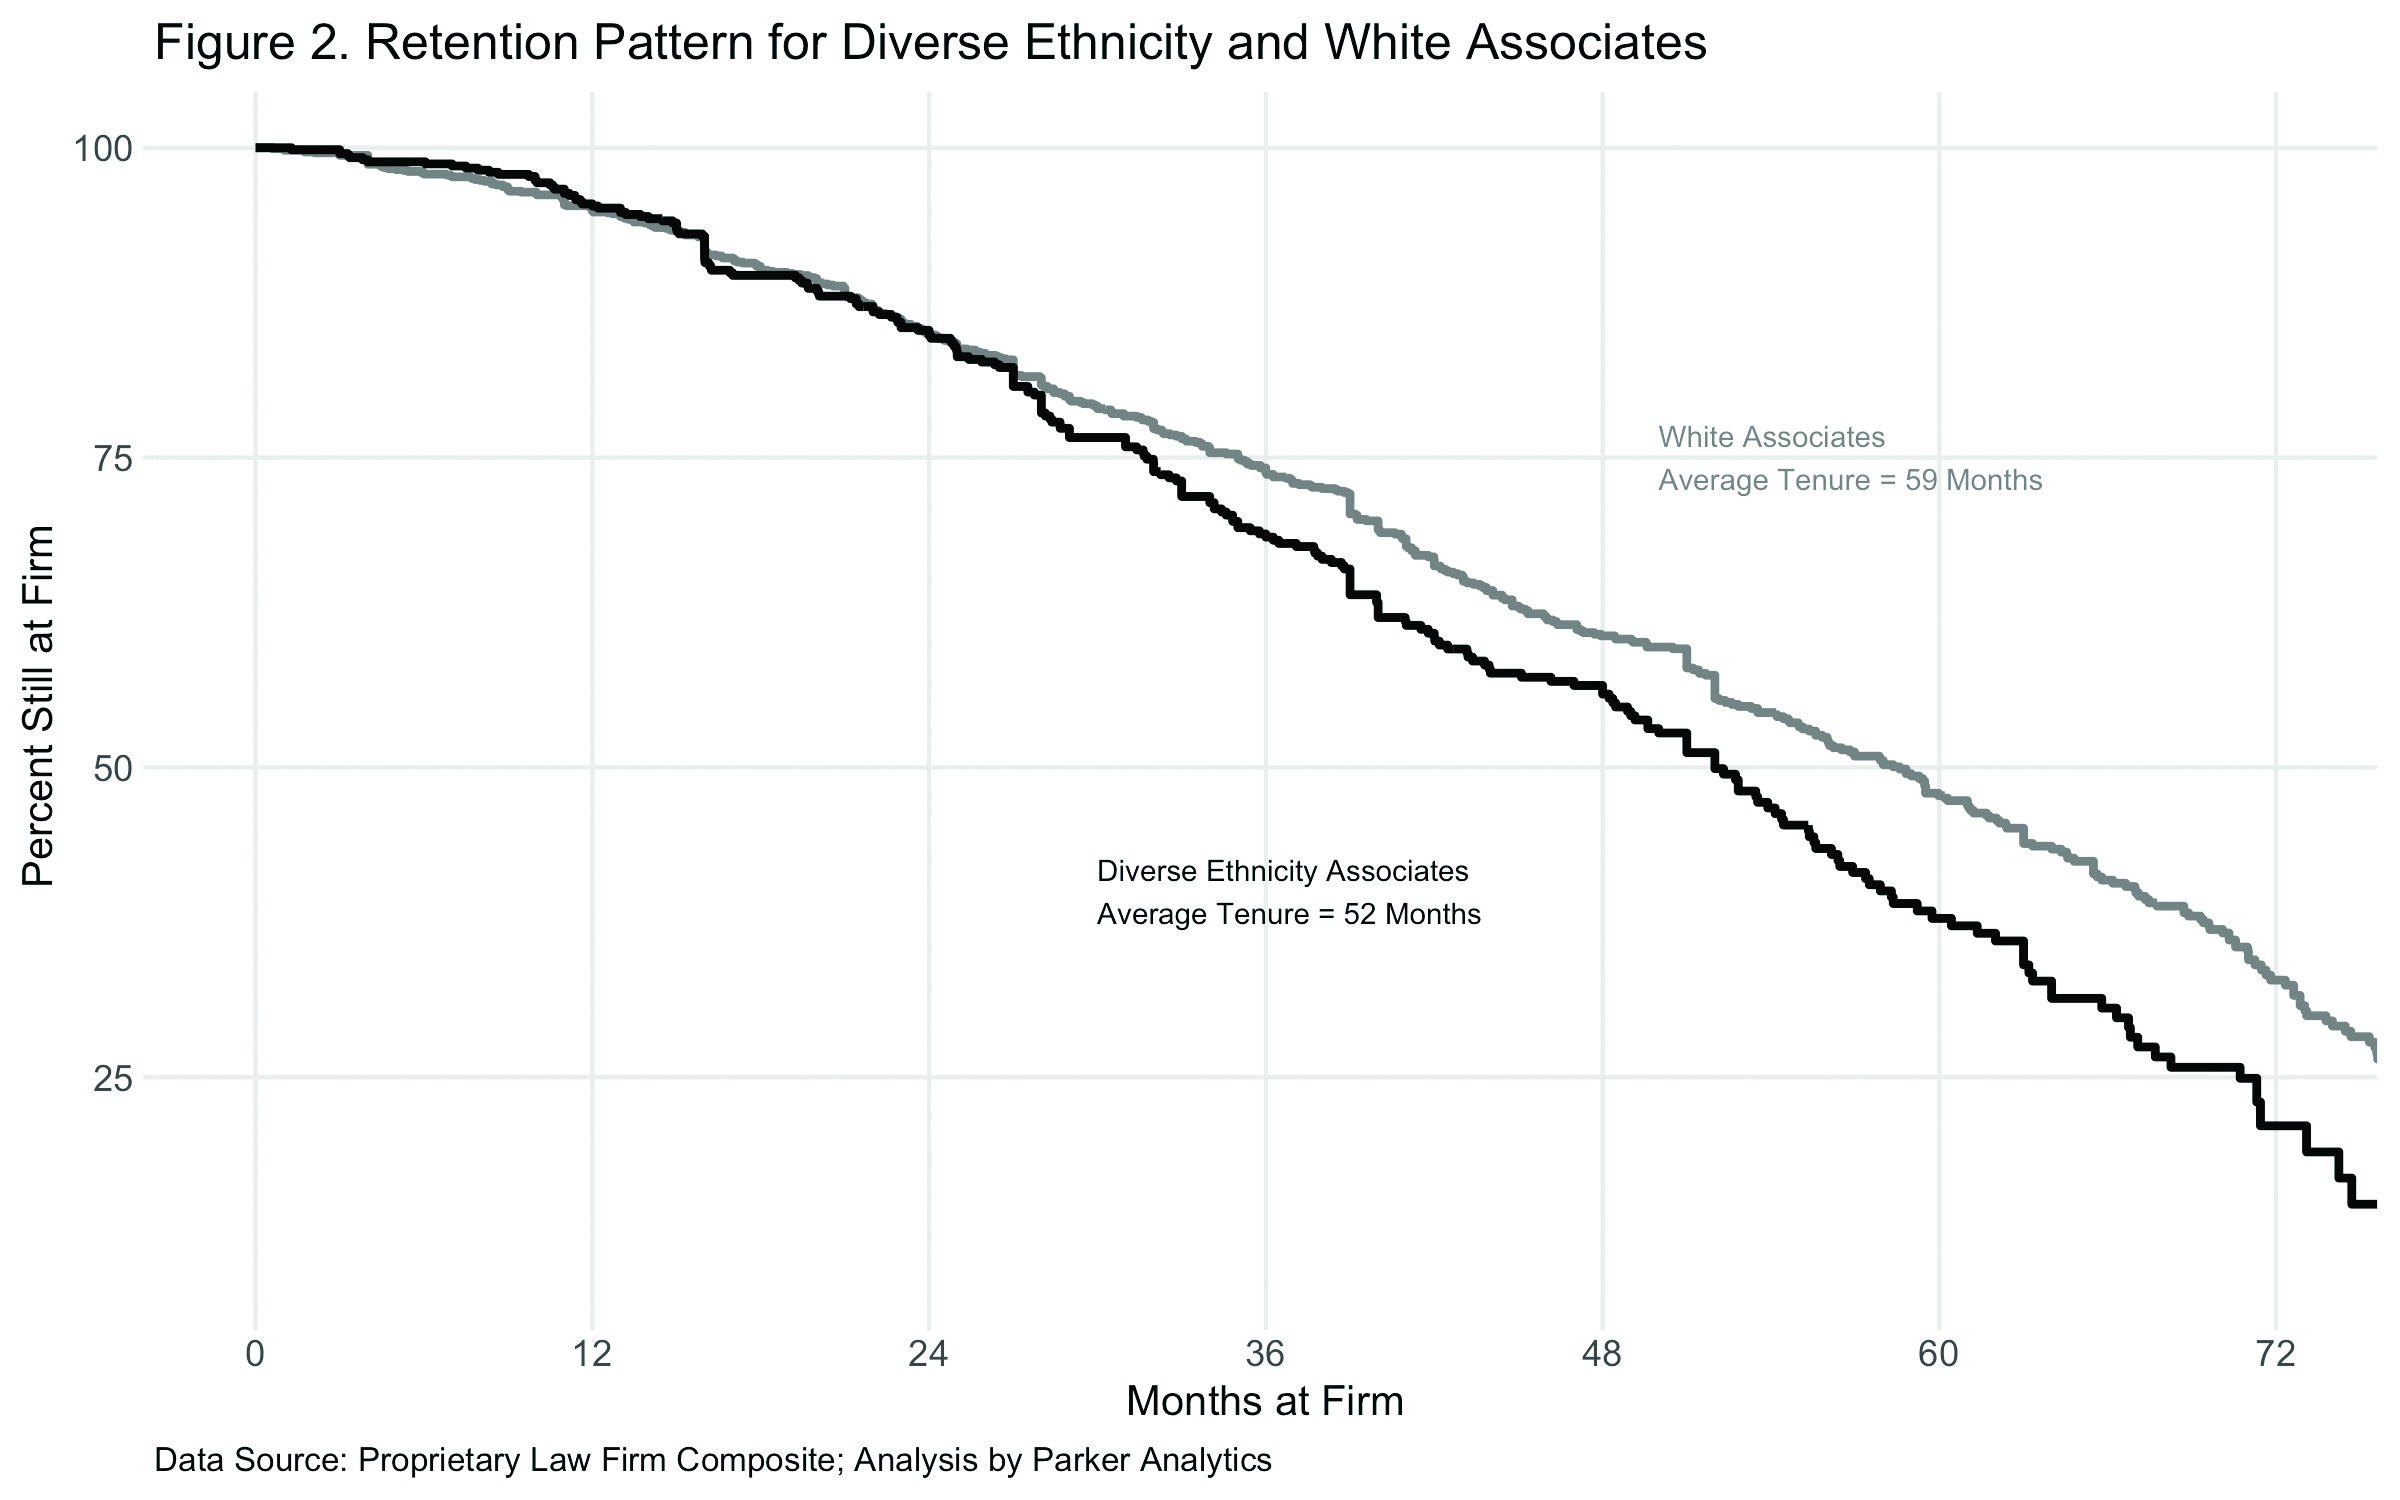
A statistical model using composite law firm retention data informs us that, all else being equal, we can expect ethnically diverse associates to stay at the firm for 52 months and white associates to stay for 59 months.

This is one takeaway from Figure 2, which I produced using “survival” analysis. While the two groups share similar attrition patterns, diverse associates are leaving seven months sooner. A benchmark like this enables DEI leaders to update beliefs and press others to do the same. The follow-up can be wide-ranging as well and expanded to include overlays with gender, practice-based differences and explanations for the asymmetry.

Conclusion
The legal industry is in the early days of an analytical awakening. Firms are experimenting with new data analytics ideas, but analytics at scale is not happening yet. However, the legal vertical is not alone. Integrating state-of-the-art analytics with enterprise data is a complex undertaking, and one that’s barely supported by the business technology giants. The good news is there are compelling interoperability solutions under development in legal.
For legal organizations, seeing the practical value of data analytics comes from concrete examples. In every case, we’re using analytics to set and refine priorities – like a firm’s susceptibility to swings in the economy, employees’ desire for increased responsibility and the tenure rates for different demographics.
The need for patient learning when using analytics is a tremendous hurdle; but the three-part analytics project outlined above is a good way to get started. Getting results lets you experience the analytics-based mental model and assess its viability. Most organizations have enough data now to find value in beginning, and then expanding, their own analytics function.


