
![]()
Triva isn't available right now.
Check out the support page for our phone number and hours
![]()
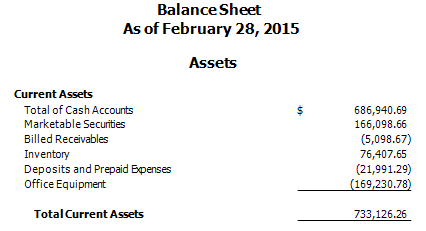
![Balance Sheet showing Current Assets. There are two categories of asset: Cash Accounts and a variable [ChartofAccountsActivity.Core.GL AccountDescription]. Instead of amounts there are variables for each of these categories, and the Total Current Assets is shown as [B4 + B6]](/content/dam/helpandsupp/en-us/Topics/accounting-cs-family/images/acs-modified-detail.png/_jcr_content/renditions/original)
 Article,
2 min read
Article,
2 min read
Article,
2 min read
Article,
2 min read